The James Webb Space Telescope records brightness at different wavelengths
The colors in James Webb images are different from the colors we would see with our eyes. Webb mainly observes infrared light, which is invisible to people. The brightness recorded through each filter is assigned a visible color, then combined into a single image.
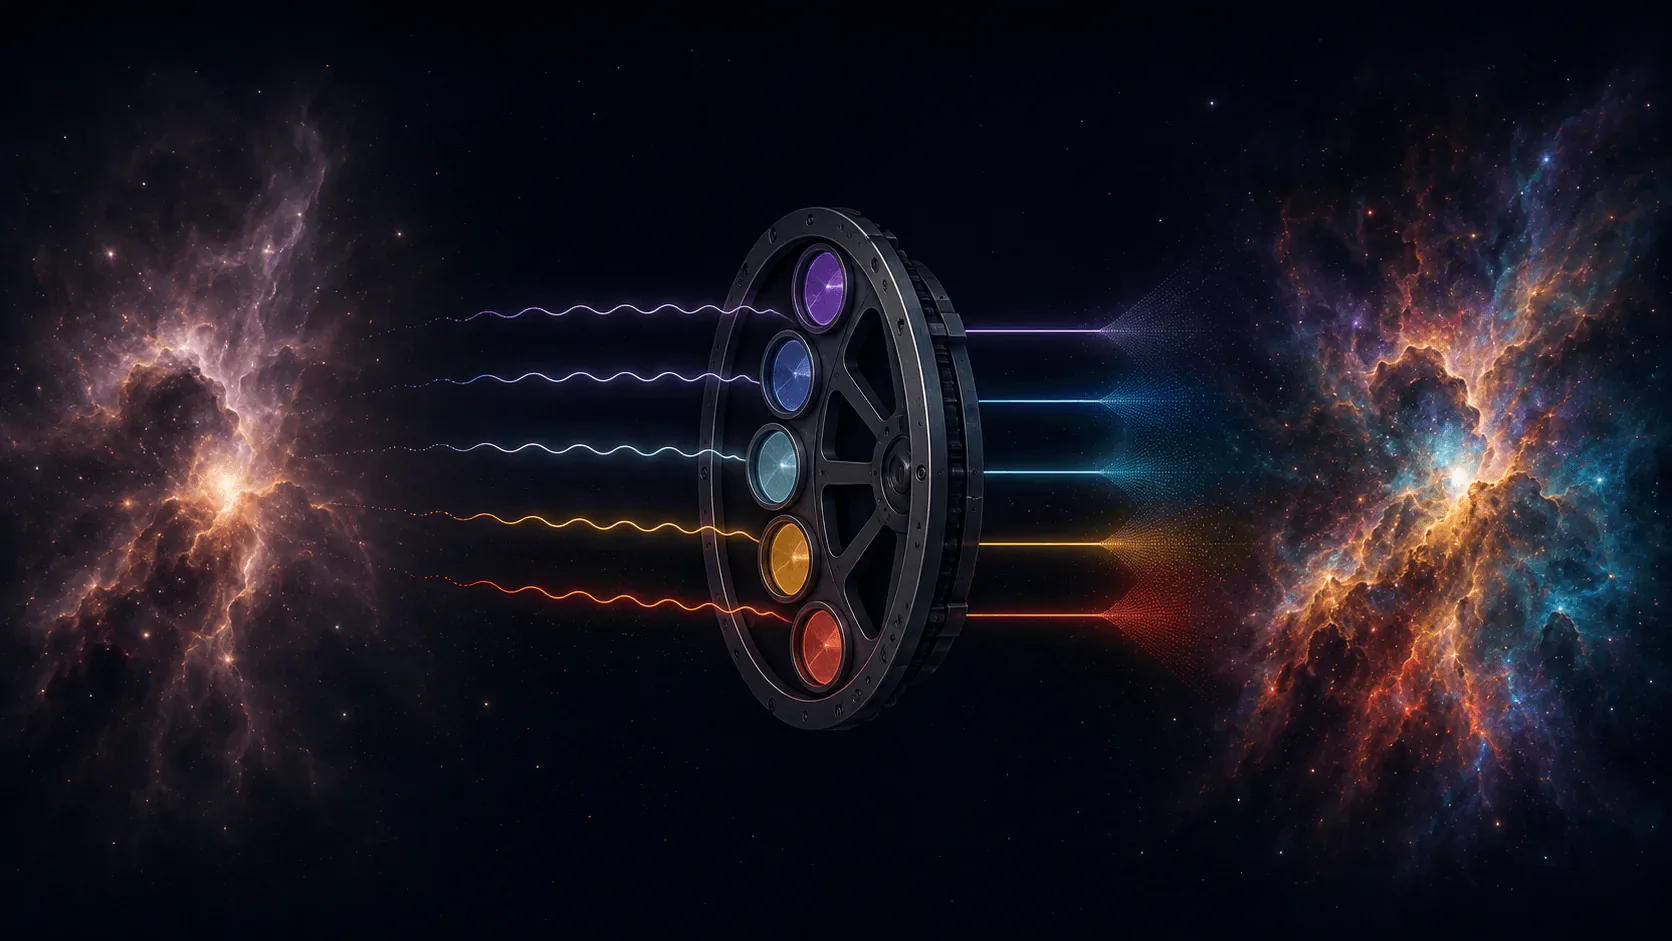
Webb’s cameras contain many filters, each of which passes a different range of wavelengths. The detector records the light that passes through a filter as a brightness value for every pixel. Data from a single filter can be viewed as a grayscale image showing brighter and darker areas.
Observing the same object through several filters reveals different structures at each wavelength. Some wavelengths pass through obscuring dust more easily, while others are emitted strongly by particular gases or dust. Assigning different colors to these data and layering them in one image makes their differences easier to compare.
Brightness data from each filter become one color image
First, the brightness range of each filter image is adjusted so that faint and bright areas can both be seen. Images that are slightly offset are aligned, and detector faults or traces left by cosmic rays are removed. A visible color is then assigned to each filter and the layers are combined.
Shorter wavelengths are usually placed toward blue and longer wavelengths toward red, translating wavelength order into color order. When more than three filters are used, intermediate colors such as yellow or orange may be added, and several filters may share one color. The mapping changes with the filter set and the structures the image is intended to emphasize.
Colors used to show light that people cannot see are called representative colors. The aligned result made from several filter images is a composite image. Brightness and structure come from observations; the image makers choose which visible color represents each filter.
The first deep field used four colors for six filters
Webb’s first deep field shows NIRCam observations in the direction of the galaxy cluster SMACS 0723. Six filters were used. F090W and F150W were assigned blue, F200W and F277W green, F356W orange, and F444W red.
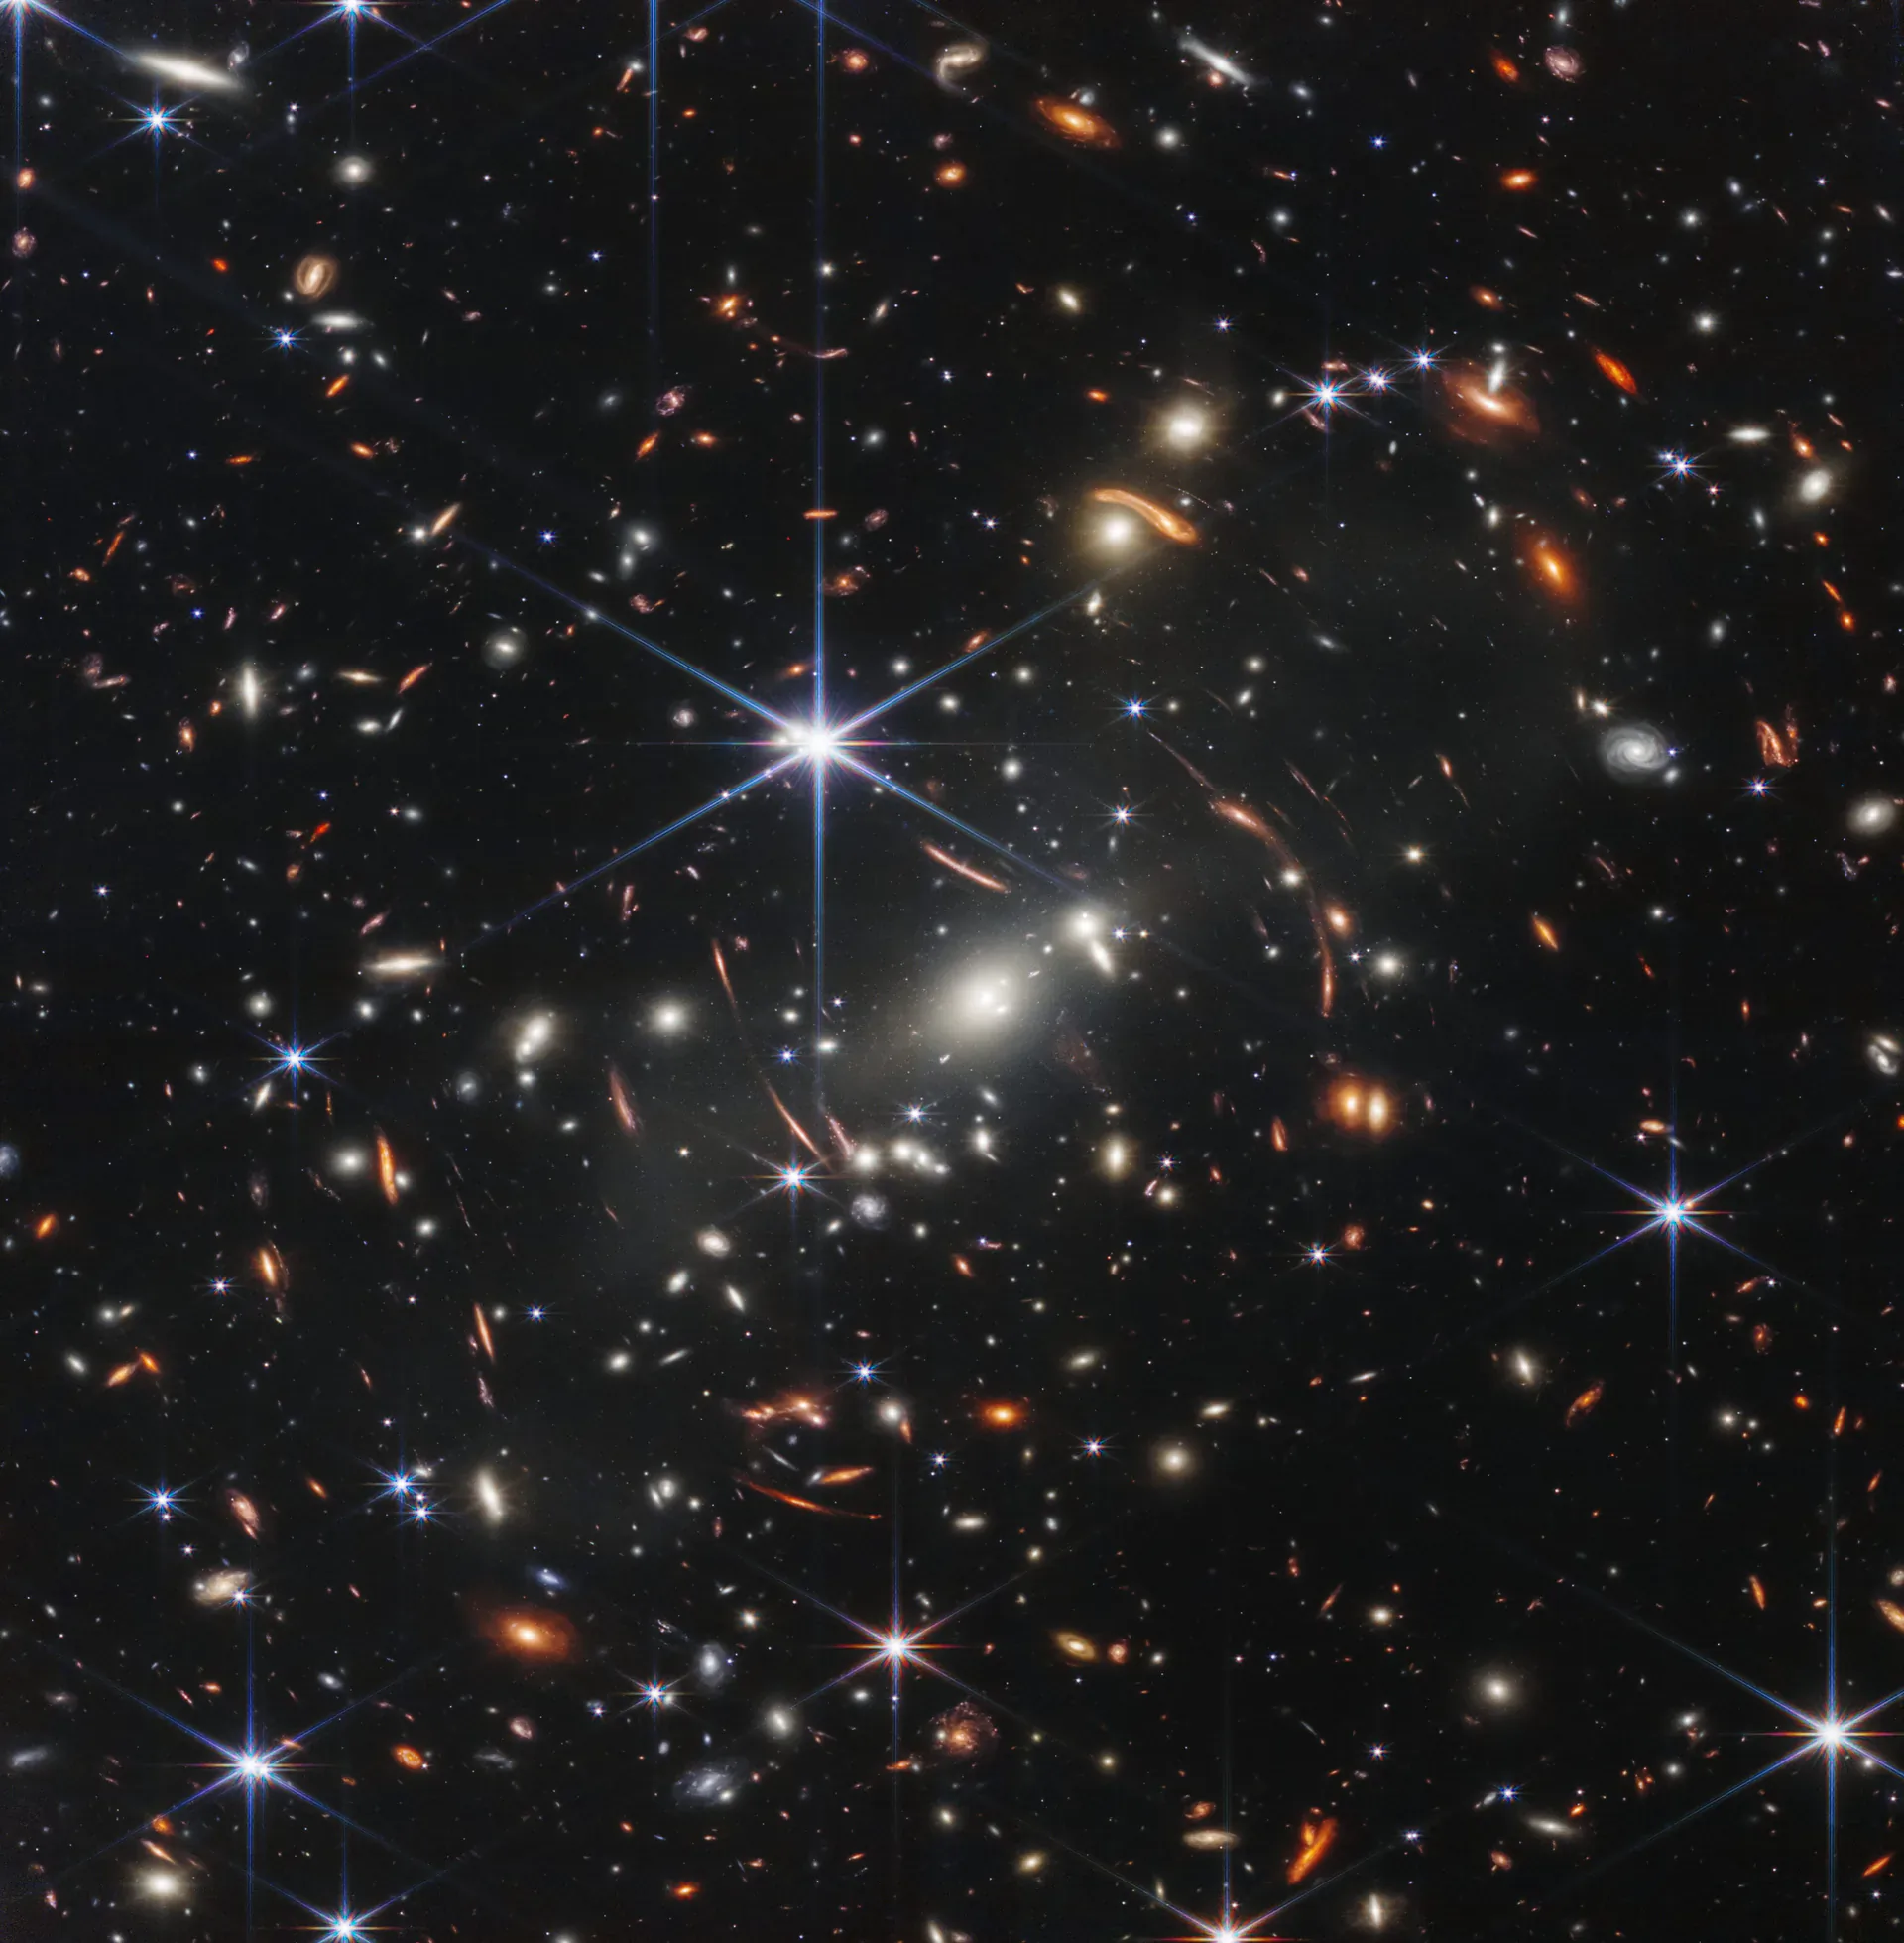
The number of filters does not have to match the number of colors in an image. In the first deep field, two filters were mapped to blue and two others to green. Blue in the image does not mean visible blue light or a single wavelength. Its filter–color key shows which observations contribute to each part of the picture.
Blue represents different wavelengths in two Southern Ring Nebula images
The Southern Ring Nebula comparison places two color images of the same object side by side. NIRCam observed the image on the left on June 3, 2022; MIRI observed the image on the right on June 12. Because the dates and wavelength ranges differ, the data from each instrument were made into separate composite images.
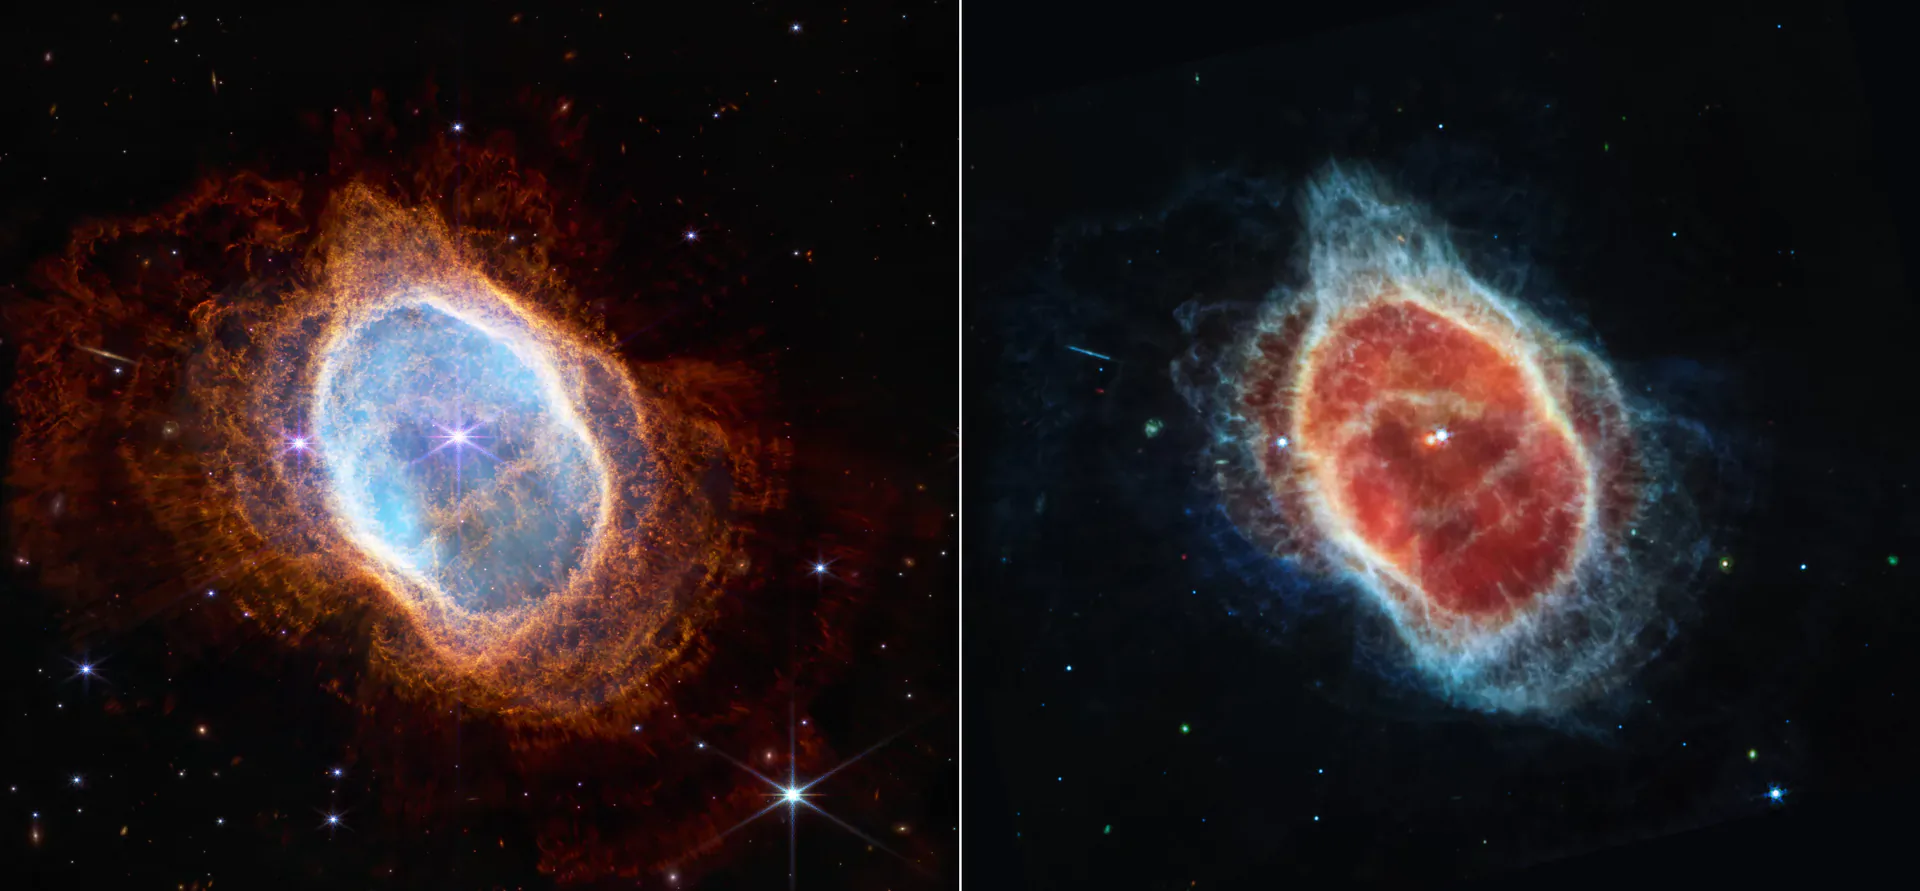
Blue in the NIRCam image on the left represents data from the F090W filter, centered near 0.9 micrometers. Blue in the MIRI image on the right represents the F770W filter near 7.7 micrometers. Although both are shown as blue, the observed wavelength ranges are very different. Each image therefore needs its own filter–color key.
Many stars and their diffraction spikes appear more clearly in the NIRCam image. The MIRI image brings out warm dust structures around the central white dwarf. Together, the two images show features that stand out at different infrared wavelengths.
Color alone cannot identify a material
Representative color helps us compare which wavelength data are strong and where dust or stars stand out. A red area on the screen, however, cannot by itself reveal the name or temperature of a material.
To identify composition, astronomers examine spectra that divide light into much narrower wavelength bands. Atoms and molecules emit or absorb light at particular wavelengths, leaving distinctive patterns. Astronomers compare these patterns with filter data and physical models to investigate an object’s properties.
Check the instrument and color key in the image description
Three details in a Webb image description help explain its colors: the instrument used, the visible color assigned to each filter, and whether several data layers were combined or separate images were placed side by side. These details show what the colors are comparing.
James Webb images translate invisible infrared measurements into colors people can distinguish. Checking the instrument and the filter–color mapping reveals which observations each color carries.
Sources
- NASA Science — How Webb’s full-color images are made
- ESA/Webb — From detector data to representative-color images
- NASA Science — Webb’s filters, detectors, and spectrographs
- NASA Science — Learning about objects through spectra
- ESA/Webb — First deep field image and filter–color information
- ESA/Webb — Southern Ring Nebula NIRCam and MIRI comparison
- STScI — NIRCam filter wavelength ranges
- STScI — MIRI filter wavelength ranges